Posts

Mysql

MySql: You deal with data every day… When you want to listen to your favorite songs, you open your playlist from your smartphone. In this case, the playlist is a database. When you take a photo and upload it to your account on a social network like Facebook, your photo gallery is a database. When you browse an e-commerce website to buy shoes, clothes, etc., you use the shopping cart database. Databases are everywhere. So what is a database?  By definition, a database is merely a structured collection of data. The data relate to each other by nature, e.g., a product belonged to a product category and associated with multiple tags. Therefore, we use the term  relational database . In the relational database, we model data like products, categories, tags, etc., using tables. A table contains columns and rows. It is like a spreadsheet. A table may relate to another table using a relationship, e.g., one-to-one and one-to-many relationships. Because we deal with a signifi

EXCEL-made easy

Ms excel is most widely used tool for financial,statistical, and mathematical analysis. How to learn excel. Learn excel by step by step: Introduction    Range Formulas and fucnction(basic that is learned before getting into fuctions chapter) Basics                                                                                                Data Analysis Ribbon Workbook Worksheet Format cells Find and select Templates Data validation keyboard shortcuts Print Share protect Functions                                                                                          VBA  count and sum logical cell references date and time text lookup and references financial statistical round formula errors array formulas

Visual Analytics

Visual analytics is useful in anlysing trends Visual analysisation we can also create. what are the visualizations we can create? many visualizations like scatter,histogram. There are three categories of datas where data falls Nominal-it cannott be compared ordinal-it be order,can compare ratio-compare,difference between,ratio data Nominal data examples: names of employee(name cannot be compared) ordinal data can be put in order...rating of employee(high,low)  ratio data : age of salary, salary of employee, ie first getting twice salary of second employee data should be categorised in that way. if student data is given ,identify it student id rank 1009          2 1008          8 1007         10 it is ordinal data department name of particluar company..it is nominal data. Based on the data given, create visualizations Scatter plot is used to relation between two sets of data. lets consider you are going to buy a car, we decide based on price and horse power tha

Mapping in Tableau

Mapping : At its core, geographical analysis Any point on map represents latitude and longitude coordinates Latitude indicates upper down Longitutde east to west. Map gives you exact insights for the measure u want to analyse

Multiple Insights through tableau

Image
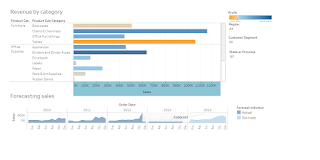
Lets say what is data visualization?  Data can be visualized pictorial. ie pictorial view of the data through tableau software Tableau offers multiple insights of the business. Lets ask tableau a different questions for the business. Lets considers the retail store data where people are performing transactions and products are ordered and sold by category. This data is huge. Let analyse First connect tableau to the excel file through navigation window and pul the tables to the canvas region of the data source page. tableau automatically assigns join conditions. If the changs have to be made in the grid view. Make changes for changing data type,custom split. First row of the table is column header and it is broken down into dimensions and measures. Lets summarize the questions which we should ask tableau in different ways. 1.What is overall trend of profit and sales of the retail stores. 2.Performance of different regions 3.Profitable and non profitable regions 4. revenu

Tableau Extract

What is extract? Creating a subset of original data. Extracting data from native environment to tableau's fast data engine. Extract data by right clicking the tableau data source where the symbol cylinder changes from one to two cylinder u can see and save it as.tde format  u can also view the extract by simply right clicking the tableau data source.

Managing Metadata-Tableau

Managing metadata is the process where we can edit,change dimensions and measures Create hierarchies, rename the dimensions and measures, group by folder and creating folder. Fields can be hidden. Rename by double click create hierarchy rearrage the order create folders right click and group by folders collapse the folders default datatype default colours and edit the colors measure right click default properties ...u can see options like agrregations, hoverin over the field  shows the comment. But in tableau online/server u cant edit the fields but u can extend the calculations. and adding calcualtion. All this a part of data connections and changing the underlying data. Finally if u want to change the data source then right click on the data source and see many options are there.